
Page 195 - Kaleidoscope Academic Conference Proceedings 2020
P. 195
Industry-driven digital transformation
More qualitative results are illustrated in Figure 7 below.
(a) Ground truth (b) Reconstructed HR image
(PSNR/SSIM = 22.65/0.4868)
HR Bi-cubic EDSR
-/- 11.91/.2758 13.34/.5100
Img_011 SRMDNF RCAN BSR (c) Difference by L2 norm (d) Difference by Lp norm
12.75/.4439 12.79/.4482 16.43/.7702
Figure 8 – Reconstructed image vs. ground truth,
calculated norms
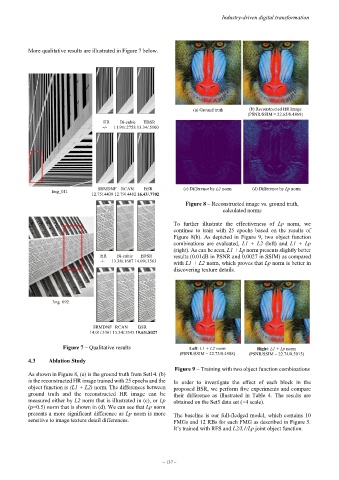
To further illustrate the effectiveness of Lp norm, we
continue to train with 25 epochs based on the results of
Figure 8(b). As depicted in Figure 9, two object function
combinations are evaluated, L1 + L2 (left) and L1 + Lp
(right). As can be seen, L1 + Lp norm presents slightly better
HR Bi-cubic EDSR results (0.01dB in PSNR and 0.0027 in SSIM) as compared
-/- 13.38/.1687 14.09/.3563 with L1 + L2 norm, which proves that Lp norm is better in
discovering texture details.
Img_092
SRMDNF RCAN BSR
14.01/.3361 15.34/.5345 19.63/.8027
Figure 7 – Qualitative results Left: L1 + L2 norm Right: L1 + Lp norm
(PSNR/SSIM = 22.73/0.4988) (PSNR/SSIM = 22.74/0.5015)
4.3 Ablation Study
Figure 9 – Training with two object function combinations
As shown in Figure 8, (a) is the ground truth from Set14. (b)
is the reconstructed HR image trained with 25 epochs and the In order to investigate the effect of each block in the
object function is (L1 + L2) norm. The differences between proposed BSR, we perform five experiments and compare
ground truth and the reconstructed HR image can be their difference as illustrated in Table 4. The results are
measured either by L2 norm that is illustrated in (c), or Lp obtained on the Set5 data set (×4 scale).
(p=0.5) norm that is shown in (d). We can see that Lp norm
presents a more significant difference as Lp norm is more The baseline is our full-fledged model, which contains 10
sensitive to image texture detail differences. FMGs and 12 RBs for each FMG as described in Figure 5.
It’s trained with RFS and L2/L1/Lp joint object function.
– 137 –