|
 |
|
The
Digital Opportunity Index (DOI) is a composite
index that measures "digital opportunity" or the
possibility for citizens of a particular country to
benefit from access to information that is
"universal, ubiquitous, equitable and affordable" (WSIS
Tunis Commitment, para 10). It uses a range of
indicators, including data on services prices and
the take-up of latest ICTs, to assess countries’
performance and prospects to measure progress in
building the Information Society in 180 economies
worldwide. It is based on a set of eleven
internationally-agreed core ICT indicators
established by the
Partnership on Measuring ICT
for Development.
Source:
ITU/KADO Digital Opportunity Platform
The DOI has a flexible modular structure, based on
three categories (see figures above):
-
Opportunity:
In order to participate in the
information society, consumers must have
accessibility to ICT service and must be able to
afford it. The percentage of the population
covered by mobile cellular telephony represents
coverage (basic accessibility) while the two
tariff indicators, Internet access tariffs as a
percentage of per capita income and Mobile
cellular tariffs as a percentage of per capita
income reflect affordability.
-
Infrastructure: Includes network
indicators such as the proportion of households with
a fixed line telephone, mobile cellular
subscribers per 100 inhabitants, proportion of
households with Internet access at home and mobile
Internet subscribers per 100 inhabitants. It
also includes the devices that provide the
interface between the user and the network; here it
is represented by proportion of households with a computer.
-
Utilization: Shows the extent of ICT
usage and includes proportion of individuals
that used the Internet. Quality
reflects a level of access that enables higher
degrees of functionality. This provides support for
services such as video streaming that can enhance
desirable information society applications such as
telemedicine, e-government and e-learning. The
indicator selected for this category is the ratio of
broadband subscribers among Internet subscribers
(separated by both fixed and mobile).
The classification is sequential, in
that each category is dependent on the previous (see
graph
above). In order to have access to
infrastructure, users must have the opportunity to
be covered by the
service and able to
afford it. Utilization depends on having
both infrastructure and an access device. Finally, given all the
prerequisites for connectivity, users will then want
to aspire to higher levels of quality through
broadband access.
The classification also reflects higher levels of
access, from basic voice communications to broadband
connectivity.
|
|
 |
|
The core infrastructure and
use of ICTs by households and individuals indicators
selected for constructing the DOI lend themselves to
various analytical possibilities. On one hand, the
index can be deconstructed along categories such as
opportunity, infrastructure and utilization. This
assists analysts in determining where countries are
relatively strong and weak and focusing attention on
priority areas.
On the other hand, the modular structure of the DOI
means that it can be split into different
components, for instance between mobile and fixed
networks and services (see figure below). This is
important, as developing countries can be assessed
on their strengths (for instance, explosive growth
in mobile communications), rather than their
weaknesses (such as limited fixed line
infrastructure). This distinction also allows the
Digital Opportunity Index to track the mobile
transition and transformation of the telecom
industry through wireless means of access.
Two paths to the
Information Society

Source:
ITU/KADO Digital Opportunity Platform
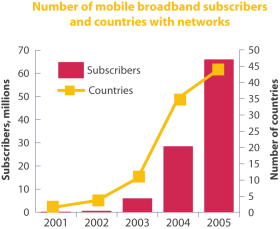
The popularity of
mobile communications and introduction of high-speed
2.5 and 3G (third generation) services make wireless
technology a key component of the information
society (see graph below). Almost all of the indicators selected for
the DOI have a mobile component. Some are explicit,
such as mobile coverage or mobile subscribers, while
others are embedded in indicators such as computers
(e.g., smart phones, PDAs) or Internet subscription
(which can include mobile Internet subscriptions).
Source:
World Information Society Report 2006
The mobile component of
the DOI allows analysis of the
relative importance of each in a country’s
progression to the information society. The trend
toward ubiquity suggests that countries should not
sacrifice one path at the expense of the other but
that both should be pursued simultaneously. |
|
More
on the DOI structure & methodology |
|
|
|
|
|
|

|
|
DOI Structure |
|
Category / indicator |
Goal-post |
Weight within category (%) |
|
Opportunity |
|
|
|
Percentage of population
covered by mobile cellular telephony |
100 |
33 |
|
Mobile cellular tariffs as
a percentage of per capita income |
0 |
33 |
|
Internet access tariffs as
a percentage of per capita income |
0 |
33 |
|
Infrastructure |
|
|
|
Proportion of households
with a fixed line telephone |
100 |
20 |
|
Mobile cellular
subscribers per 100 inhabitants |
100 |
20 |
|
Proportion of households
with Internet access at home |
100 |
20 |
|
Mobile Internet
subscribers per 100 inhabitants |
100 |
20 |
|
Proportion of households
with a computer |
100 |
20 |
|
Utilization |
|
|
|
Internet users per 100
inhabitants |
100 |
33 |
|
Ratio of (Fixed) Broadband
Internet subscribers to total Internet
subscribers |
100 |
33 |
|
Ratio of (Mobile)
Broadband Internet subscribers to mobile
Internet subscribers |
100 |
33 |
|
Note:
The indicator is divided by the goalpost to
obtain the sub index value. The
weighted value is obtained by multiplying
the sub index by the weight shown in this table.
The Digital Opportunity Index is
calculated by averaging the three category
scores. |
|
|
 |
|
Name of index (organization) |
Economies |
Indicators |
Latest
data |
Comments |
|
Digital Opportunity Index
(ITU/UNCTAD/KADO)20 |
180
|
11
|
2004/05
|
Three clusters: Utilization, Infrastructure and
Opportunity |
|
ICT Opportunity Index (ORBICOM/ITU)21
|
139
|
17
|
2003
|
Compares ‘Infostates‘, ‘Infodensity‘ and ‘InfoUse‘
against an imaginary economy called ‘Hypothetica‘. |
|
ICT Development Index (UNCSTD)22 |
180 |
8 |
2003 |
Four clusters: Access, Connectivity, Usage and
Policy. |
|
Informational Society Index (IDC)23 |
52 |
15 |
2004 |
Only sparse methodological data is disclosed. |
|
E-Readiness Index
(EIU/IBM)24 |
68
|
31
|
2004/05
|
Six clusters: Connectivity, Business environment,
Adoption, Legal and policy environment, social and cultural
environment, Supporting e-services. Uses a mix of
quantitative and survey data. |
|
Network Readiness Index (InfoDev/ WEF/INSEAD)25 |
102
|
48
|
2003
|
Three clusters: Environment, Readiness, Usage. Uses a
mix of survey, qualitative and quantitative data. |
|
Digital Access Index (ITU)26 |
179 |
8 |
2002 |
Five clusters: Infrastructure, Affordability, Knowledge,
Quality, Usage. |
|
Mobile/Internet Index (ITU)27 |
171 |
26 |
2001 |
Three clusters: Infrastructure, usage, market conditions. |
|
Technology Achievement Index (UNDP)28 |
71 (full data) |
8 |
1998-2000 |
Four clusters: Creation of technology, Diffusion of
recent innovations, Diffusion of old innovations, Human
skills. |
 |
|
Further, the Digital Opportunity Index includes innovative and
promising new technologies, such as broadband and
mobile internet. This means that the DOI can be used
to assess the growth and take-up of new ICTs. It will
thus remain relevant for some time to come, unlike
more traditional connectivity indicators (e.g. fixed
lines), which may become less and less relevant for
developing countries through the expansion of mobile
telephony networks, advanced wireless connectivity
and own leapfrogging. The DOI is forward-looking in
terms of each country’s distinctive ICT development
trajectory.

Source:
World Information Society Report 2006
The most popular indicator when
discussing the Information Society is the proportion of
the population using the Internet. As more and more
countries conduct surveys on Internet usage, our
understanding about how many people are accessing the
Internet is improving. Even if people use the Internet
from public facilities, they will be included as users.
Indeed, the indicator is crucial for measuring the
success of government policies in providing public
Internet facilities.

Source:
World Information Society Report 2006
Many of the most desirable
applications envisioned for the Information Society are
only possible through broadband access. This has made
the availability of high-speed Internet service a key
policy objective in both developed and developing
nations. Two indicators are included in the DOI to
measure broadband: the ratio of fixed broadband
subscriptions (e.g., Digital Subscriber Lines, access
over cable television networks, etc.) to total Internet
subscriptions and the ratio of mobile broadband
subscriptions to total mobile subscriptions.

Source:
World Information Society Report 2006
Since these ratios reflect quality
of usage rather than sheer penetration, developing
countries are less disadvantaged by these indicators.
The proportion of fixed broadband subscriptions is used
in both developed and developing countries as a policy
indicator. Given the right mix of policy and regulatory
encouragement, it is possible that all Internet
subscriptions could eventually migrate to broadband. |
|


