
Page 3 - The affordability of ICT services 2023
P. 3
The affordability of ICT services 2023
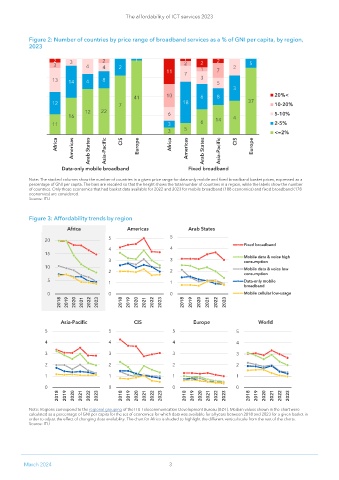
Figure 2: Number of countries by price range of broadband services as a % of GNI per capita, by region,
2023
2 3 2 1 1 2 2
3 4 4 2 2 2 5
11 7 1 7
13 14 4 8 3 5
3
41 10 6 8 20%<
12 7 18 37 10-20%
12 22 6 5-10%
16 14 4
11 3 6 2-5%
3 5 <=2%
Africa Americas Arab States Asia-Pacific CIS Europe Africa Americas Arab States Asia-Pacific CIS Europe
Data-only mobile broadband Fixed broadband
Note: The stacked columns show the number of countries in a given price range for data-only mobile and fixed broadband basket prices, expressed as a
percentage of GNI per capita. The bars are rescaled so that the height shows the total number of countries in a region, while the labels show the number
of countries. Only those economies that had basket data available for 2022 and 2023 for mobile broadband (188 economies) and fixed broadband (178
economies) are considered.
Source: ITU
Figure 3: Affordability trends by region
Africa Americas Arab States
Fixed broadband
Mobile data & voice high
consumption
Mobile data & voice low
consumption
Data-only mobile
broadband
Mobile cellular low-usage
2018 2019 2020 2021 2022 2023 2018 2019 2020 2021 2022 2023 2018 2019 2020 2021 2022 2023
Asia-Pacific CIS Europe World
2018 2019 2020 2021 2022 2023 2018 2019 2020 2021 2022 2023 2018 2019 2020 2021 2022 2023 2018 2019 2020 2021 2022 2023
Note: Regions correspond to the regional grouping of the ITU Telecommunication Development Bureau (BDT). Median values shown in the chart were
calculated as a percentage of GNI per capita for the set of economies for which data was available for all years between 2018 and 2023 for a given basket in
order to adjust the effect of changing data availability. The chart for Africa is shaded to highlight the different vertical scale from the rest of the charts.
Source: ITU
March 2024 3