
Page 111 - Proceedings of the 2017 ITU Kaleidoscope
P. 111
Challenges for a data-driven society
Table 3. A depiction of the characterising (peculiar) features emerging for each series (S i ).
S/N Location PDE(%) Day Time Vic Sus VAge SAge SFr Mot MO HCol Mask Sub-Ab
1 35 (S1) 1 1 1 1 0 0 1 0 1 1 0 0
Mowbray
2 65 (S2) 1 1 1 1 0 1 1 1 1 1 1 1
3 CapeTown 50 (S1) 0 1 1 1 0 0 1 1 1 1 0 0
4 Central 50 (S2) 1 1 1 1 0 1 1 0 1 0 0 0
5 40(S1) 1 1 1 1 0 1 1 0 1 1 0 0
6 Wynberg 34(S2) 1 1 1 0 1 0 0 1 1 0 1 1
7 26(S3) 0 1 0 1 0 1 1 0 1 1 0 0
8 Grassy- 21(S1) 1 1 1 0 0 0 0 1 1 1 0 1
9 Park 79(S2) 1 1 1 1 0 1 1 1 1 0 1 0
and ”1” for S1 and S2 respectively. Each of the series has
at least six features characterising the offender’s MO, which
aligns with the initial proposition and similarity (threshold)
condition for this research. [h!]
It is clear from Table 3 that the operating times for the se-
ries and the capture method (called MO in the data as this
is the term police use for it) are features that are highly con-
sistent throughout the identified series, which is as antici-
pated, while some other features such as motivation (Mot)
and Victim age (VAge) are not very consistent across series
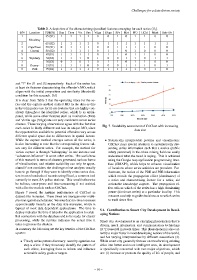
clusters. These varying observations agree with the fact that Fig. 7. Scalability assessment of CriClust with increasing
each series is likely different and has its unique MO, since
data size
the opportunities available to potential offenders vary across
different spatial space due to differences in spatial factors.
While the capture method emerges across all the series, it • Statistically interpretable patterns and visualisation:
is also interesting to note that the corresponding feature val- CriClust pays special attention to systematically pre-
ues vary for different series. For example, the method for senting series information such that a novice (public
victim capture is through “kidnapping’ in one instance and safety personnel) in the crime mining field can easily
“substance-influence” in some other series. The usefulness understand what the trend is saying. This is achieved
of this research in terms of clusters generated, various forms using the Google map application programming inter-
of visualisations, and relative scalability can only be appre- face (GMAPI), which helps to enhance visualisation
ciated if one considers the challenge crime analysts usually of locations where series activities are prevalent. Fur-
have to go through if they were to identify crime series clus- thermore, the notion of the PDE and PSE information
ters in even hundreds of records using Excel, a common tool which reveals the propagation effect (dominance) of
currently in most SA police stations. This would otherwise a series and characterising feature for a series, aid
be tedious, error-prone and time-consuming if not assisted actionable knowledge support. The propagation ef-
with effective models such as CriClust. fect tells us which of the series has a high dominating
Figure 7 reveal the runtime performance of CriClust as power (dominant series) at a particular locality. This
dataset size increases. These times are averages over multi- measure can help to guide decisions as to which series
ple runs against each dataset. We note that run-time increases to track down first.
approximately linearly as the data size increases, which is
typical of most data dependent applications. The time to
5.1. Contribution to Smart City Development in Devel-
deploy indicates the time it takes for the application to estab-
oping Nations
lish connection with the database and to be ready for cluster
processing, while the runtime indicates the actual time it Smart city development is an emerging phenomenon that is
takes to process the clusters. driving much information and communication technology
In summary the following are the key benefits of the CriClust (ICT) research in recent times. This phenomenon is also cur-
system: rently a major focus in most developing nations of the world,
and has varying interpretations by different researchers [3].
• Timely series pattern discovery: security agencies can While smart city generally focuses on transforming existing
stop a crime if they timeously identify the pattern of cities into better and more intelligent ones, its development
such crime, leveraging these to inform and influence is specifically concerned with two major objectives, which
actionable safety goals or targets. are: (i) increase or promote the quality of life of people; and
– 95 –