
Page 92 - ITU Journal, ICT Discoveries, Volume 3, No. 1, June 2020 Special issue: The future of video and immersive media
P. 92
ITU Journal: ICT Discoveries, Vol. 3(1), June 2020
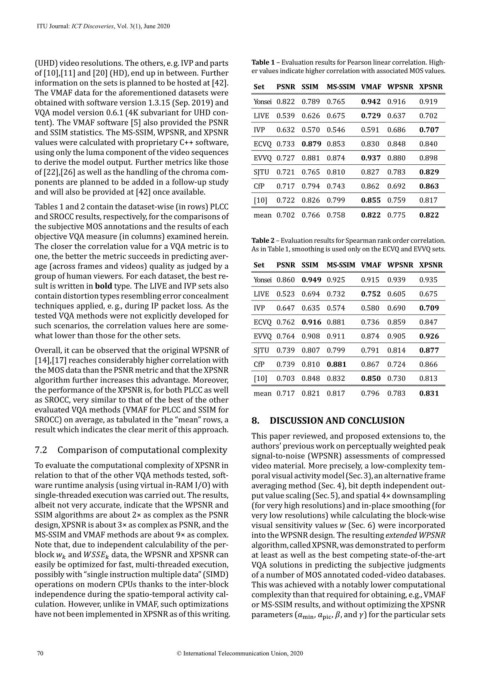
(UHD) video resolutions. The others, e.g. IVP and parts Table 1 – Evaluation results for Pearson linear correlation. High-
of [10],[11] and [20] (HD), end up in between. Further er values indicate higher correlation with associated MOS values.
information on the sets is planned to be hosted at [42].
Set PSNR SSIM MS-SSIM VMAF WPSNR XPSNR
The VMAF data for the aforementioned datasets were
obtained with software version 1.3.15 (Sep. 2019) and Yonsei 0.822 0.789 0.765 0.942 0.916 0.919
VQA model version 0.6.1 (4K subvariant for UHD con-
LIVE 0.539 0.626 0.675 0.729 0.637 0.702
tent). The VMAF software [5] also provided the PSNR
and SSIM statistics. The MS-SSIM, WPSNR, and XPSNR IVP 0.632 0.570 0.546 0.591 0.686 0.707
values were calculated with proprietary C++ software, ECVQ 0.733 0.879 0.853 0.830 0.848 0.840
using only the luma component of the video sequences
to derive the model output. Further metrics like those EVVQ 0.727 0.881 0.874 0.937 0.880 0.898
of [22],[26] as well as the handling of the chroma com- SJTU 0.721 0.765 0.810 0.827 0.783 0.829
ponents are planned to be added in a follow-up study CfP 0.717 0.794 0.743 0.862 0.692 0.863
and will also be provided at [42] once available.
[10] 0.722 0.826 0.799 0.855 0.759 0.817
Tables 1 and 2 contain the dataset-wise (in rows) PLCC
and SROCC results, respectively, for the comparisons of mean 0.702 0.766 0.758 0.822 0.775 0.822
the subjective MOS annotations and the results of each
objective VQA measure (in columns) examined herein.
Table 2 – Evaluation results for Spearman rank order correlation.
The closer the correlation value for a VQA metric is to As in Table 1, smoothing is used only on the ECVQ and EVVQ sets.
one, the better the metric succeeds in predicting aver-
age (across frames and videos) quality as judged by a Set PSNR SSIM MS-SSIM VMAF WPSNR XPSNR
group of human viewers. For each dataset, the best re-
Yonsei 0.860 0.949 0.925 0.915 0.939 0.935
sult is written in bold type. The LIVE and IVP sets also
contain distortion types resembling error concealment LIVE 0.523 0.694 0.732 0.752 0.605 0.675
techniques applied, e. g., during IP packet loss. As the IVP 0.647 0.635 0.574 0.580 0.690 0.709
tested VQA methods were not explicitly developed for
such scenarios, the correlation values here are some- ECVQ 0.762 0.916 0.881 0.736 0.859 0.847
what lower than those for the other sets. EVVQ 0.764 0.908 0.911 0.874 0.905 0.926
Overall, it can be observed that the original WPSNR of SJTU 0.739 0.807 0.799 0.791 0.814 0.877
[14],[17] reaches considerably higher correlation with
CfP 0.739 0.810 0.881 0.867 0.724 0.866
the MOS data than the PSNR metric and that the XPSNR
algorithm further increases this advantage. Moreover, [10] 0.703 0.848 0.832 0.850 0.730 0.813
the performance of the XPSNR is, for both PLCC as well
mean 0.717 0.821 0.817 0.796 0.783 0.831
as SROCC, very similar to that of the best of the other
evaluated VQA methods (VMAF for PLCC and SSIM for
SROCC) on average, as tabulated in the “mean” rows, a 8. DISCUSSION AND CONCLUSION
result which indicates the clear merit of this approach.
This paper reviewed, and proposed extensions to, the
authors’ previous work on perceptually weighted peak
7.2 Comparison of computational complexity
signal-to-noise (WPSNR) assessments of compressed
To evaluate the computational complexity of XPSNR in video material. More precisely, a low-complexity tem-
relation to that of the other VQA methods tested, soft- poral visual activity model (Sec.3),an alternative frame
ware runtime analysis (using virtual in-RAM I/O) with averaging method (Sec. 4), bit depth independent out-
single-threaded execution was carried out. The results, put value scaling (Sec. 5), and spatial 4× downsampling
albeit not very accurate, indicate that the WPSNR and (for very high resolutions) and in-place smoothing (for
SSIM algorithms are about 2× as complex as the PSNR very low resolutions) while calculating the block-wise
design, XPSNR is about 3× as complex as PSNR, and the visual sensitivity values (Sec. 6) were incorporated
MS-SSIM and VMAF methods are about 9× as complex. into the WPSNR design. The resulting extended WPSNR
Note that, due to independent calculability of the per- algorithm,called XPSNR,was demonstrated to perform
block and data, the WPSNR and XPSNR can at least as well as the best competing state-of-the-art
easily be optimized for fast, multi-threaded execution, VQA solutions in predicting the subjective judgments
possibly with “single instruction multiple data” (SIMD) of a number of MOS annotated coded-video databases.
operations on modern CPUs thanks to the inter-block This was achieved with a notably lower computational
independence during the spatio-temporal activity cal- complexity than that required for obtaining, e. g., VMAF
culation. However, unlike in VMAF, such optimizations or MS-SSIM results, and without optimizing the XPSNR
have not been implemented in XPSNR as of this writing. parameters ( , , , and ) for the particular sets
70 © International Telecommunication Union, 2020