
Page 10 - U4SSC Case study: City solid waste management, June 2020
P. 10
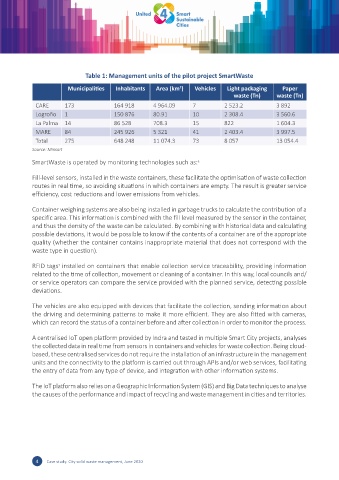
Table 1: Management units of the pilot project SmartWaste
                         Municipalities   Inhabitants   Area (km )   Vehicles    Light packaging    Paper
                                                                2
                                                                                   waste (Tn)     waste (Tn)
              CARE      173              164 918       4 964.09      7          2 523.2           3 892
              Logroño   1                150 876       80.91         10         2 308.4           3 560.6
              La Palma  14               86 528        708.3         15         822               1 604.3
              MARE      84               245 926       5 321         41         2 403.4           3 997.5
              Total     275              648 248       11 074.3      73         8 057             13 054.4
            Source: Minsait

            SmartWaste is operated by monitoring technologies such as: 6

            Fill-level sensors, installed in the waste containers, these facilitate the optimisation of waste collection
            routes in real time, so avoiding situations in which containers are empty. The result is greater service
            efficiency, cost reductions and lower emissions from vehicles.

            Container weighing systems are also being installed in garbage trucks to calculate the contribution of a
            specific area. This information is combined with the fill level measured by the sensor in the container,
            and thus the density of the waste can be calculated. By combining with historical data and calculating
            possible deviations, it would be possible to know if the contents of a container are of the appropriate
            quality (whether the container contains inappropriate material that does not correspond with the
            waste type in question).

            RFID tags  installed on containers that enable collection service traceability, providing information
                      7
            related to the time of collection, movement or cleaning of a container. In this way, local councils and/
            or service operators can compare the service provided with the planned service, detecting possible
            deviations.

            The vehicles are also equipped with devices that facilitate the collection, sending information about
            the driving and determining patterns to make it more efficient. They are also fitted with cameras,
            which can record the status of a container before and after collection in order to monitor the process.

            A centralised IoT open platform provided by Indra and tested in multiple Smart City projects, analyses
            the collected data in real time from sensors in containers and vehicles for waste collection. Being cloud-
            based, these centralised services do not require the installation of an infrastructure in the management
            units and the connectivity to the platform is carried out through APIs and/or web services, facilitating
            the entry of data from any type of device, and integration with other information systems.


            The IoT platform also relies on a Geographic Information System (GIS) and Big Data techniques to analyse
            the causes of the performance and impact of recycling and waste management in cities and territories.


              4  Case study: City solid waste management, June 2020