
Page 11 - U4SSC Case study: City solid waste management, June 2020
P. 11
Results
The project pilot deployed in the management units offers data that will serve to improve the collecting
process and to take measures that encourage recycling in citizens and municipalities. These data come
from the IoT network, but they can also be linked to other information systems like the census, so the
platform allows setting correlations between the recycling process and other variables like density of
population, building occupation, family members, age, level of education, and so on. The information
obtained by SmartWaste can be used for the internal management of the processes, but also made
public to the citizens, in order to support raising awareness about waste recycling.
These indicators are grouped to form rates that are displayed in different visions of a Balanced Scorecard,
depending on the stakeholder to whom the information is directed:
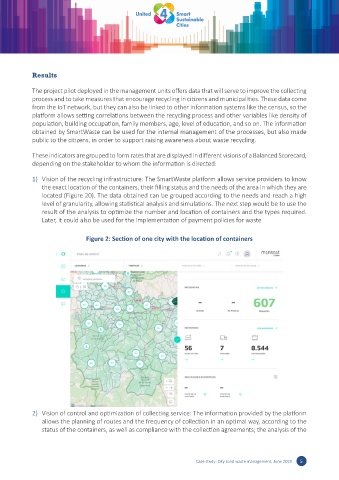
1) Vision of the recycling infrastructure: The SmartWaste platform allows service providers to know
the exact location of the containers, their filling status and the needs of the area in which they are
located (Figure 20). The data obtained can be grouped according to the needs and reach a high
level of granularity, allowing statistical analysis and simulations. The next step would be to use the
result of the analysis to optimize the number and location of containers and the types required.
Later, it could also be used for the implementation of payment policies for waste
Figure 2: Section of one city with the location of containers
2) Vision of control and optimization of collecting service: The information provided by the platform
allows the planning of routes and the frequency of collection in an optimal way, according to the
status of the containers, as well as compliance with the collection agreements; the analysis of the
Case study: City solid waste management, June 2020 5