
Page 67 - Proceedings of the 2018 ITU Kaleidoscope
P. 67
Machine learning for a 5G future
2. FROM MEASUREMENTS TO TIME SERIES 2.2 Spectrum Availability Matrix
2.1 Collecting data The Wi-Fi data includes the information of 461 frequency
channels, with a time resolution equal to one third of a
In March 2012, a collection of data from the radioelectric second. In total, the Wi-Fi database has 4.978.800 data and a
spectrum was conducted in the city of Bogotá, Colombia. A Wi-Fi assessment of 829,800 [17].
spectrum analyzer was used to detect the traffic based on the
power of the signals. Consequently, the gathered information
indicates whether the signals are present or absent during the
defined sampling time. The captured data is located within
the GSM, Wi-Fi and 1850 MHz to 2000 MHz bands [16].
The equipment used to capture the measurements of the
spectrum were a Discone antenna set in the 25 MHz – 6 GHz
frequency range, a low noise amplifier (LNA) running in the Figure 2 – Building the availability matrix from the power
20 MHz - 8 GHz frequency range and a spectrum analyzer matrix
operating in the 9 kHz – 7.1 GHz range [17]. The map of the
spectrum measurement campaign in the city of Bogotá is
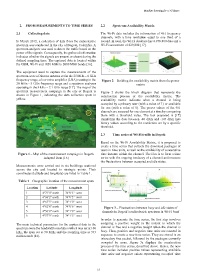
Figure 2 shows the block diagram that represents the
shown in Figure 1, indicating the data collection spots in construction process of the availability matrix. The
yellow.
availability matrix indicates when a channel is being
occupied by a primary user (with a value of 1) or available
for use (with a value of 0). The power values of the 461
channels are assessed for one element at a time by comparing
them with a threshold value. The tool proposed in [17]
transforms the data between -40 dBm and -147 dBm into
binary values according to the restriction set by a specific
threshold.
2.3 Time series of Wi-Fi traffic in Bogotá
Based on the Wi-Fi Availability Matrix, it is proposed to
create a time series that collects the download packages of
users in time units, as well as the availability of consecutive
Figure 1 – Map of the measurement campaign in Bogotá. time instants within the channel. The idea is to form a time
Adapted from [16] series with the ongoing tendency of a channel and measure
the fluctuations between occupied and idle states.
Measurements were carried out in six buildings scattered
across the city and located in strategic points. Their
coordinates (latitude and longitude) are listed in Table 1.
Table 1 – Geographic location of the measurement spots
Location Latitude Longitude
1 4°73’0” north 74°0’5’’ west
2 4°68’2” north 74°0’5’’ west
3 4°65’5” north 74°1’0’’ west
4 4°62’8” north 74°0’6’’ west
Figure 3 – Fluctuations between busy and idle states of
5 4°58’8” north 74°1’0’’ west channels in Bogotá’s radioelectric spectrum in Wi-Fi band
6 4°57’9” north 74°1’5’’ west
In order to generate the time series, the first step involves
assigning a positive weight in the instant in which the
The main technical parameters for the captured data in the
channel is free and a negative weight when the channel is
spectrum were the bandwidth resolution which was set at 100
busy. Then, positive and negative time units are counted in
kHz, the span set at 50 MHz and the scanning time at 333
sequence to create a new time series. They are stored in an
milliseconds [16].
intercalary free packet, followed by the packages currently
occupied by users. Figure 3a displays the construction
process of the time series, described above. Hence, the new
time series includes positive values representing available
time units and negative values representing occupied time
– 51 –